Client-Scope RFM: Turning two years of transaction history into a customer strategy.
An end-to-end RFM segmentation pipeline that identifies exactly which customers drive revenue, which are slipping away, and what to do about each group.
Overview
A UK-based online gift retailer had racked up two years of transactions and no clear picture of who its customers actually were. Every customer got the same treatment (same emails, same offers, same priority), regardless of whether they were a top-tier repeat buyer or someone who'd bought once and vanished. This project builds the missing layer: a data-driven segmentation that turns a raw transaction log into a small set of actionable customer groups, each with a specific recommended action.
The Problem
Without segmentation, marketing spend and retention effort get spread evenly across a customer base that behaves very unevenly. A handful of customers might generate most of the revenue while going unrecognized; others might be quietly churning while still receiving generic campaigns. The goal was to answer three questions with data instead of guesswork: who are our best customers, who's at risk of leaving, and who's worth the effort to win back?
Approach
Working from the UCI Online Retail II dataset; roughly a million transactions across ~37 countries, spanning 2009–2011; the project follows a five-stage pipeline:
Data cleaning: dedup exact-match transactions, drop rows with no customer ID, normalize product codes, and separate genuine purchases from cancellations.
RFM feature engineering: for every customer, compute Recency (days since last purchase), Frequency (distinct invoices), and Monetary value (total spend), calculated two ways: on valid purchases only, and on all activity including cancellations.
Distribution correction: RFM values are heavily right-skewed (a few customers spend orders of magnitude more than most), so each feature is log-transformed and standardized before clustering.
Cluster selection: K-means is evaluated across k = 2 to 10 using both the elbow method (inertia) and silhouette score, balancing statistical fit against how interpretable the resulting segments are for a marketing team. k = 4 was chosen for both RFM approaches.
Segment profiling & recommendations: each resulting segment gets a plain-English profile (typical recency/frequency/spend, dominant country, top product) and a specific recommended action.
Results
The segmentation surfaced a clear, actionable structure hiding in the transaction data:
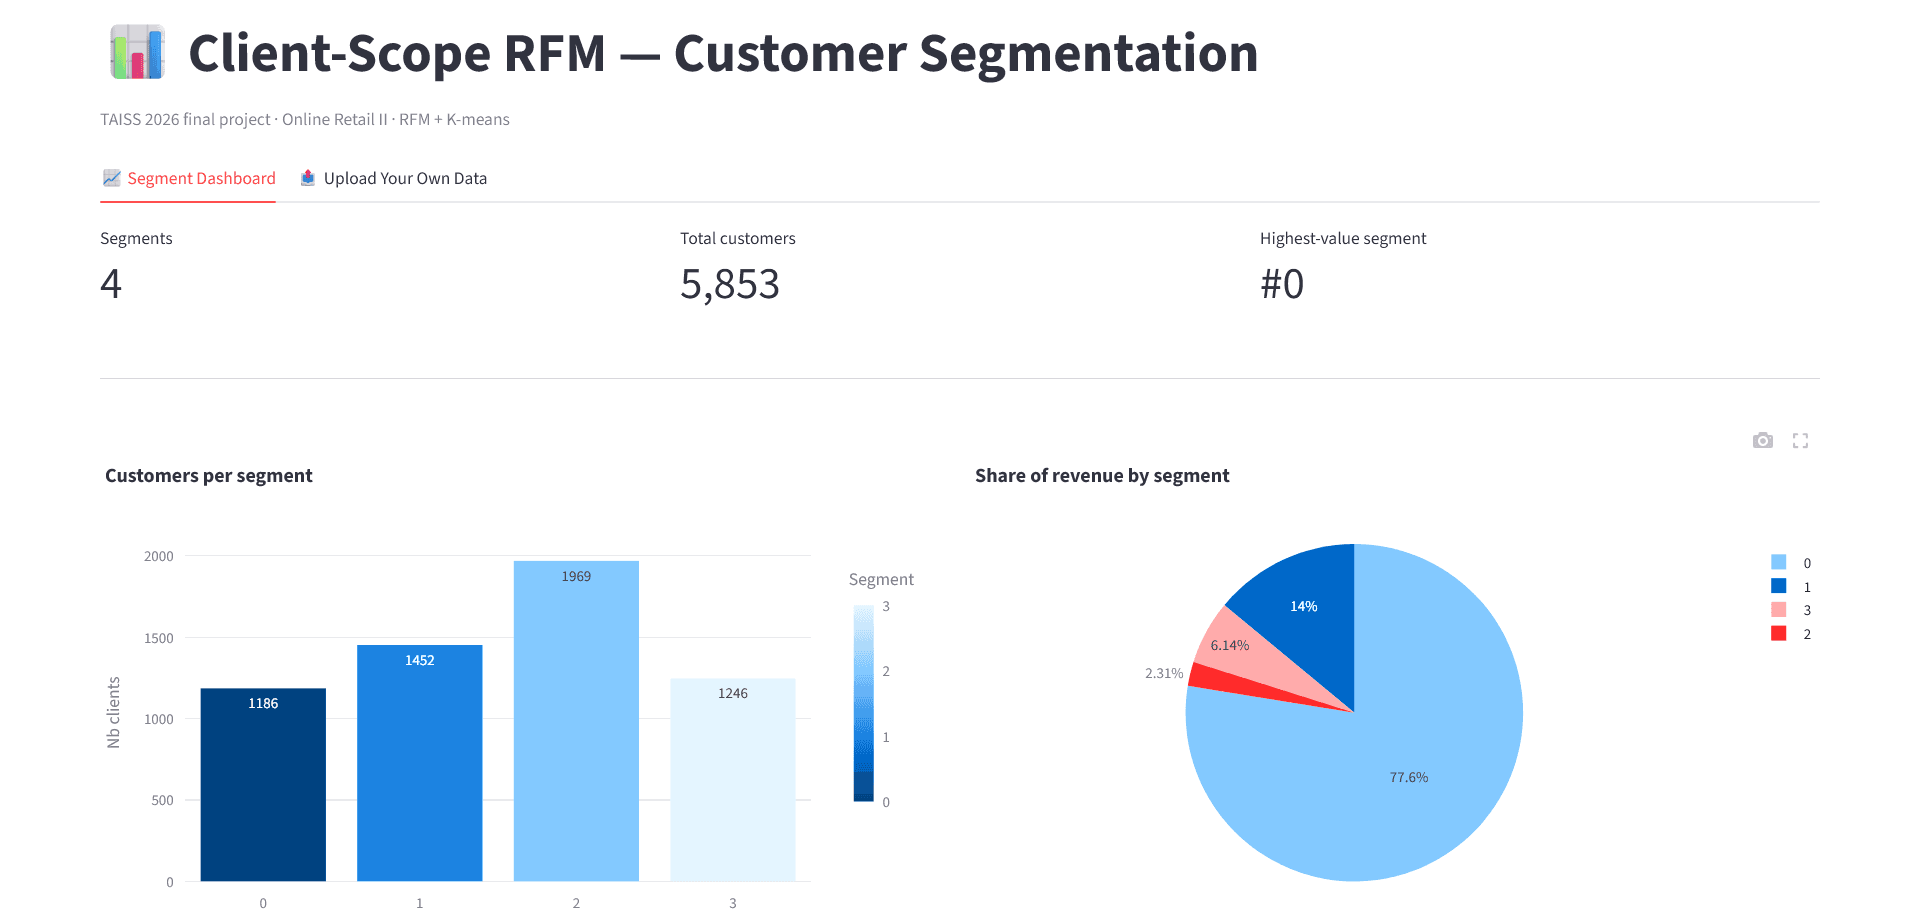
Champions (1,186 customers, ~20% of the base) generate 73.9% of total revenue, with an average recency of just 28 days. Recommendation: prioritize retention (VIP program, early access, personalized thank-yous).
At-risk high-value (1,452 customers) contribute 16.3% of revenue but haven't purchased in ~228 days on average. Recommendation: priority win-back contact before they're gone for good.
New/single-purchase customers (1,246 customers) are recent (28 days) but contribute only 6.1% of revenue. Recommendation: onboarding flow and a targeted offer to drive the second purchase.
Dormant (1,969 customers) haven't purchased in over a year on average and contribute just 3.7% of revenue. Recommendation: urgent reactivation campaign or accept the loss and deprioritize.
The finding: roughly a fifth of customers account for nearly three-quarters of revenue; a textbook Pareto pattern that had been completely invisible without segmentation.
Try It Yourself
The full analysis is available as a live, interactive dashboard. Browse the finished segments, or upload your own transaction data and watch the pipeline run in real time.
🔗 Live demo: https://client-scope-rfm-taiss2026-final-project.streamlit.app/
🔗 Source code: github.com/othnielchristian/client-scope-rfm-taiss2026-final-project
Tech Stack
Python · pandas · scikit-learn (K-means, silhouette scoring) · NumPy / SciPy · Streamlit (dashboard) · Plotly (visualizations) · Docker (reproducible environment) · Jupyter (analysis notebooks)